Netherlands eScience Center
National platform for the development and application of domain overarching software and methods for the scientific community
oTree Development Environment
A Docker environment for programming against multiple oTree server
- oTree
- (Dockerfile)
- (Makefile)
- (Shell)
oTree Waiting Room
A load balancer for oTree servers.
- oTree
- (HTML)
- (JavaScript)
- (Shell)
Paired omics data platform
If you do metabolomics experiments with mass spectra and have sequenced the genomes of the samples, then the platform can help you link them.
- Inter-operability & linked data
- (CSS)
- (Dockerfile)
- (HTML)
- + 3
PanTools
PanTools is a pangenomic toolkit for comparative analysis of large number of genomes. It is developed in the Bioinformatics Group of Wageningen University, the Netherlands. Please cite the relevant publication(s) from the list of publications if you use PanTools in your research.
- Data Analysis
- Gene classification
- pangenomics
- (Java)
- (Python)
- ("Roff Manpage")
- + 1
paradigma
A toolbox to calculate digital biomarkers for wearable sensors in Parkinson's disease.
- ("Jupyter Notebook")
- (Python)
parareal
This package runs the parareal algorithm on a black-box simulator. Parallelisation is managed through Dask.
- High performance computing
- Numerical analysis
- (CSS)
- (Dhall)
- (HTML)
- + 5
PattyAnalytics
Library for aligning and scaling one point cloud to an other.
- Big data
- Point Cloud
- (Python)

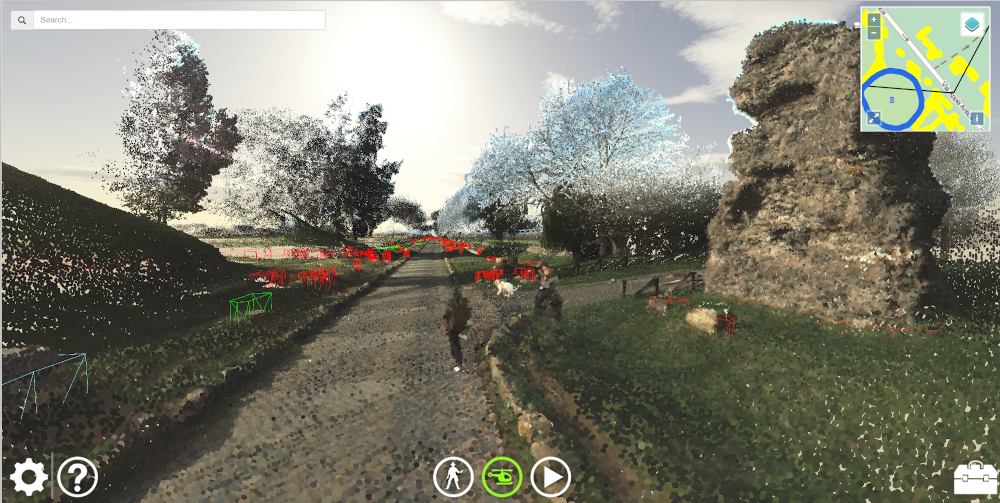
Via Appia Visualization
A web application which visualizes the point clouds and additional data gathered in the Via Appia project with WebGL.
- Visualization
- (CSS)
- (HTML)
- (JavaScript)

pbg-ld
Access integrated data on genes and associated traits in plants
- Data Analysis
- genomics
- Inter-operability & linked data
- (Dockerfile)
- (Makefile)
- (PLpgSQL)
- + 2
pdb2sql
Fast and versatile Python package that leverages SQL queries to parse, manipulate and process biomolecular structure files. The structure files should be in the PDB format and are available on www.rcsb.org.
- Big data
- Optimized data handling
- (Makefile)
- (Python)
- (TeX)
pdbtbx-ts
Want to parse Protein Data Bank files in JavaScript
- Optimized data handling
- (JavaScript)
- (Rust)
- (TypeScript)

PerfectFit
This is a virtual coach system that coaches users into being more physically active and stop smoking.
- Big data
- health
- (Gherkin)
- (JavaScript)
- (Shell)