Via Appia Visualization

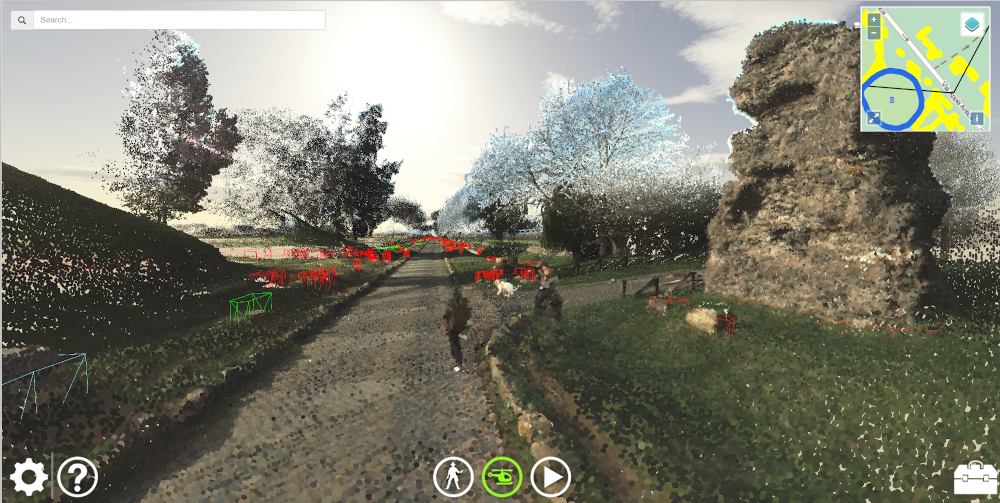
A web application which visualizes the point clouds and additional data gathered in the Via Appia project with WebGL.
46
mentions
8
contributors
Get started
434 commitsLast commit ≈ 75 months ago13 stars11 forks

Cite this software

What Via Appia Visualization can do for you

  • A 3D interactive web application for archeology
  • Visualizes LiDAR data and Structure-From-Motion data as well as extensive meta-information.
  • Explore an extensive Archeology dataset from the comfort of your own home.
Logo of Via Appia Visualization
Keywords
Programming languages
  • JavaScript 83%
  • HTML 13%
  • CSS 3%
License
</>Source code

Participating organisations

Social Sciences & Humanities
Netherlands eScience Center
Radboud University Nijmegen
Vrije Universiteit Amsterdam

Reference papers

Mentions

Contributors

Ben van Werkhoven
Ben van Werkhoven
Janneke van der Zwaan
Maarten van Meersbergen
Mateusz Kuzak
Mateusz Kuzak
Maurice de Kleijn
Maurice de Kleijn

Related projects

Mapping the Via Appia in 3D

Developing a 4D geographic information system for archaeological purposes

Updated 20 months ago
Finished

Related software

AHN2 pointcloud viewer

AH

A web application able to visualize the AHN2 point cloud data of the Netherlands.

Updated 14 months ago
25 3

Revisited Via Appia

RE

Create visual storylines that involve media like images and videos embedded in a 3D environment with efficient Pointcloud data directly from the web browser.

Updated 9 months ago
3 2