All software

ESMValTool
The Earth System Model eValuation Tool is a community diagnostics and performance metrics tool for the evaluation of Earth System Models that allows for routine comparison of models and observations.
- Big data
- Optimized data handling
- Visualization
- + 1
- (Dockerfile)
- ("Emacs Lisp")
- (Jinja)
- + 7

ESMValCore
ESMValTool Core: core functionalities and driver for ESMValTool, a community diagnostic and performance metrics tool for routine evaluation of Earth System Models in CMIP.
- Big data
- Optimized data handling
- Visualization
- + 1
- (Dockerfile)
- (HTML)
- (JavaScript)
- + 4

MAGMa
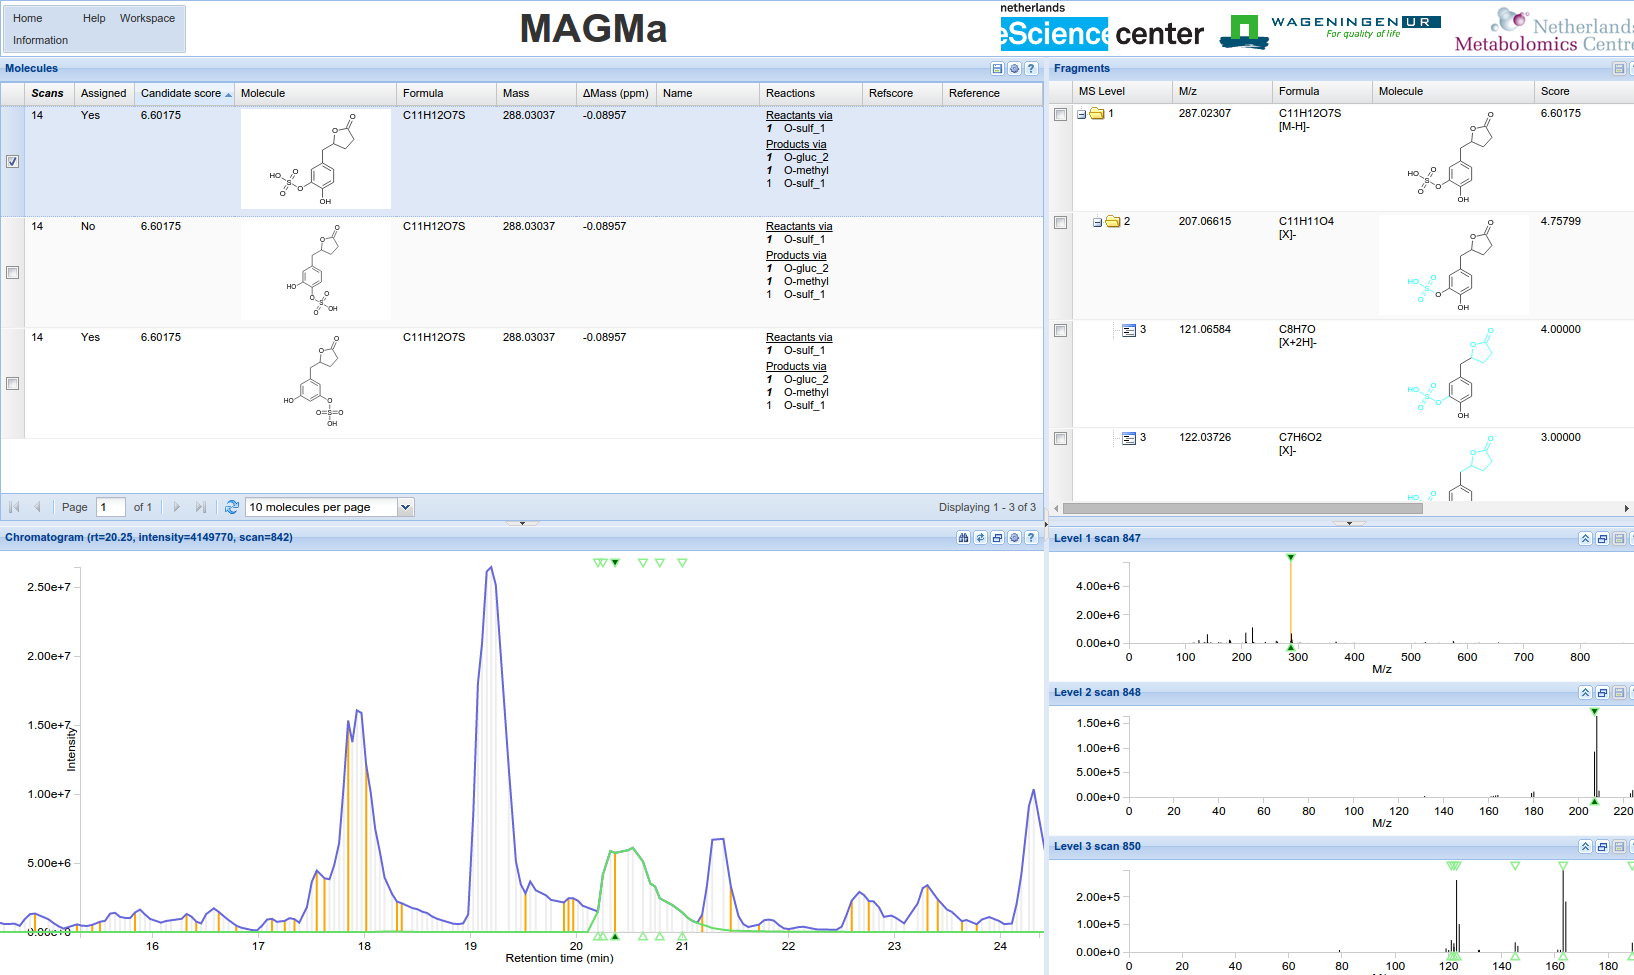
MAGMa is an online application for the automatic chemical annotation of mass spectrometry data.
- Big data
- Visualization
- (CSS)
- (Cython)
- (Dockerfile)
- + 5
Twiqs
Software behind the web server twiqs.nl, which has provided free access to statistics about Dutch tweets since 2010
- Big data
- Text analysis & natural language processing
- Visualization
- (HTML)
- (Java)
- (JavaScript)
- + 3

Via Appia Visualization
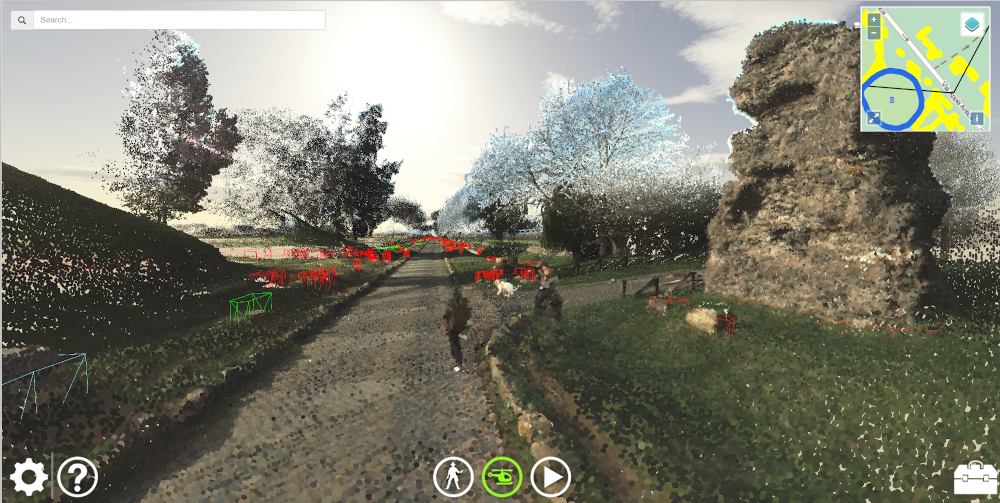
A web application which visualizes the point clouds and additional data gathered in the Via Appia project with WebGL.
- Visualization
- (CSS)
- (HTML)
- (JavaScript)
fsbrain
The fsbrain package provides visualization of neuroimaging data in R. The plots produced by fsbrain can be integrated into R notebooks or written to high-quality bitmap image files, ready for publication.
- Computational Neuroscience
- Visualization
- (Dockerfile)
- (R)
- (Shell)

GSA report
GSAreport is an application to easily generate reports that describe the global sensitivities of your input parameters as best as possible. You can use the reporting application to inspect which features are important for a given real world function / simulator or model.
- Explainable AI
- Machine learning
- python
- + 1
- (CSS)
- (HTML)
- ("Jupyter Notebook")
- + 1

KNIME molecule viewer nodes
A 3D viewer for large molecules for the KNIME workflow system.
- Visualization
- Workflow technologies
- (CSS)
- (Java)
- (JavaScript)

LitStudy
Explore scientific literature using Python from the comfort of a Jupyter notebook
- Inter-operability & linked data
- Text analysis & natural language processing
- Visualization
- (HTML)
- (Python)

AHN2 pointcloud viewer
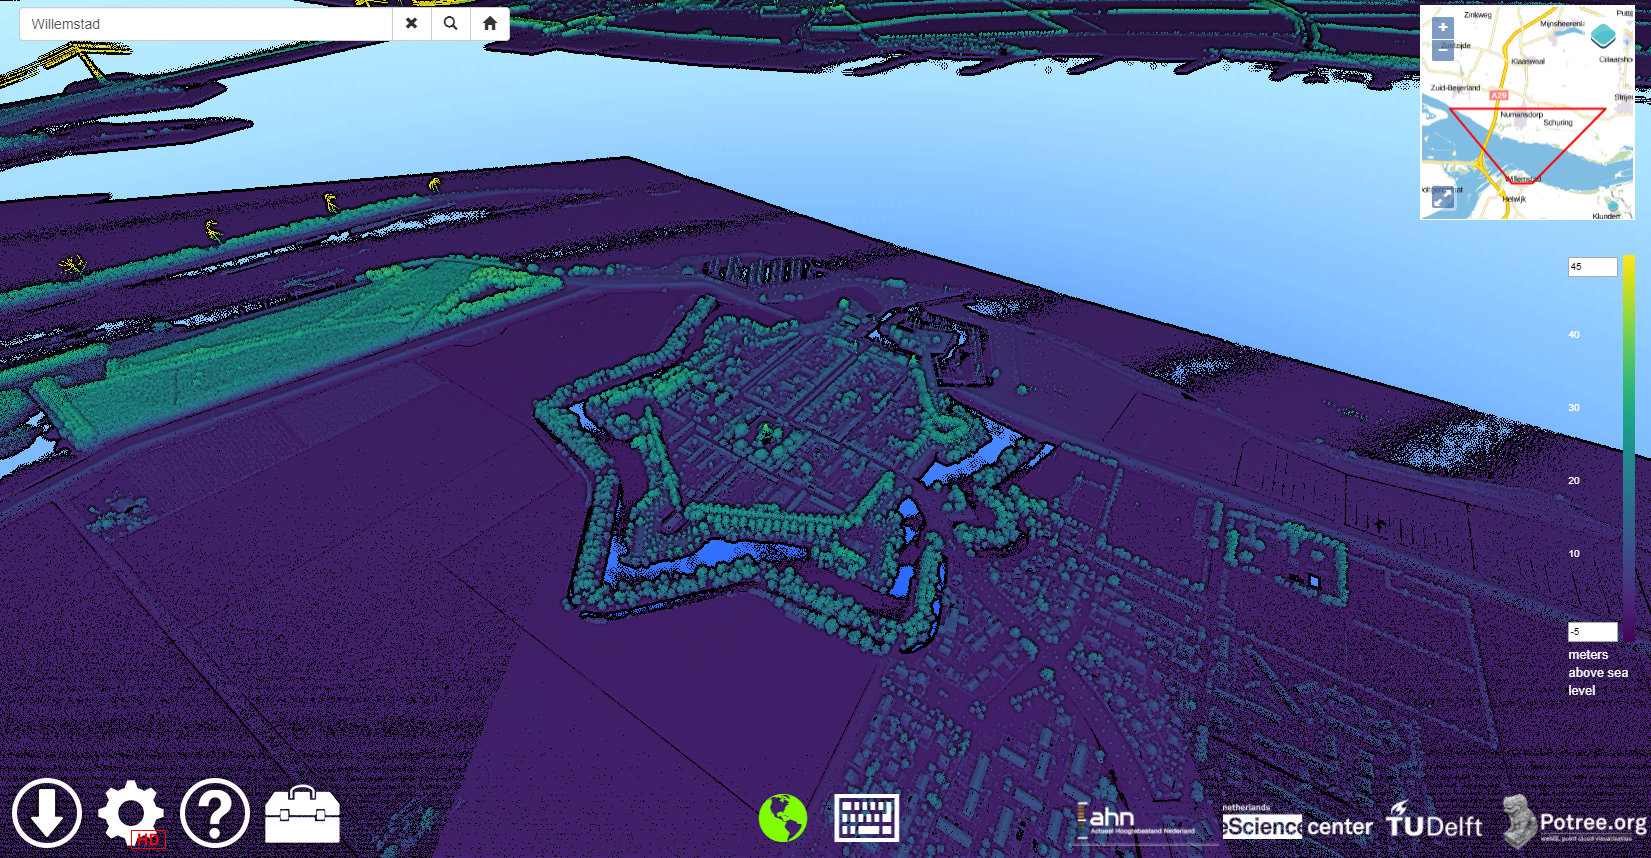
A web application able to visualize the AHN2 point cloud data of the Netherlands.
- Big data
- Real time data analysis
- Visualization
- (CSS)
- (Dockerfile)
- (HTML)
- + 1
AHN point cloud viewer web service
A web service to serve large point cloud data efficiently using octrees.
- Big data
- Visualization
- (Java)
- (Python)
talkr
{talkr} is an R package that offers a set of convenience functions for quality control, visualisation and analysis of conversational data. Most notably it provides a range of plotting functions that play well with ggplot and the tidyverse.
- conversation
- talk
- turn-taking
- + 1
- (R)
- (Rez)